
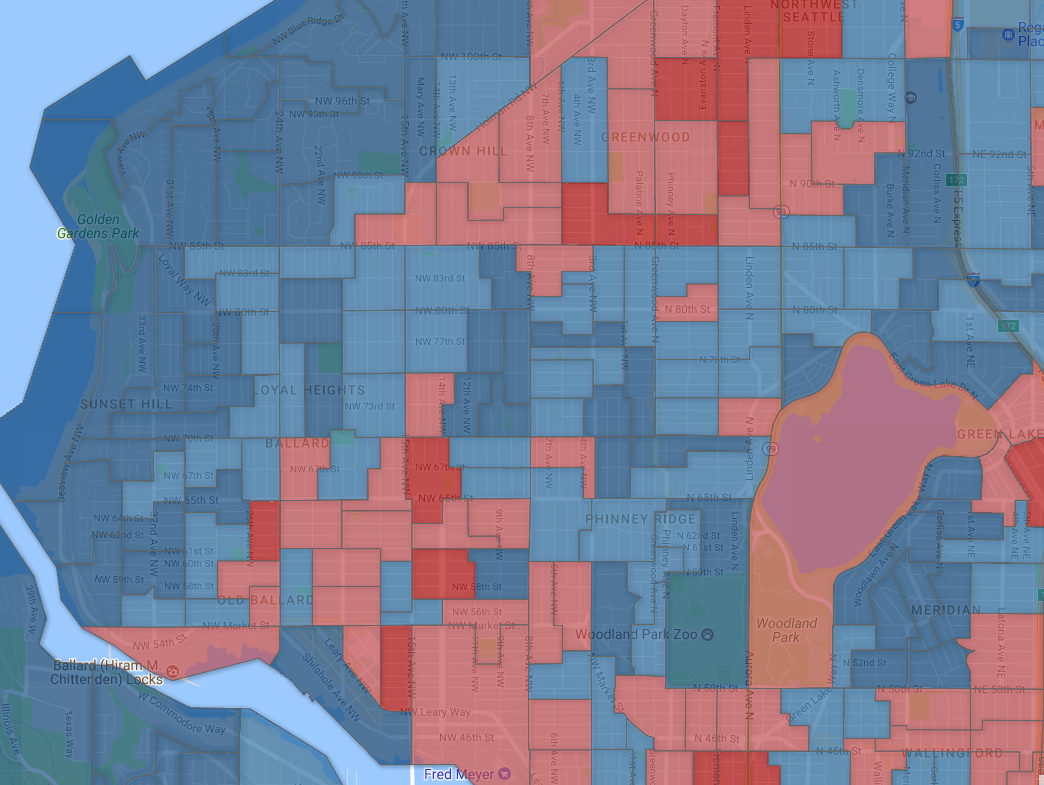
With the election count finalized, Phil Gardner plotted the data on detailed maps that illustrate how different neighborhoods — down to small sections of neighborhoods — voted for mayor.
This is the Ballard area map above (you can browse the interactive version here), with Jenny Durkan in blue and Cary Moon in red. While Ballard’s core and Crown Hill leaned for Moon, Loyal Heights, Whittier Heights, Sunset Hill and North Beach went for Durkan.
This pattern repeats itself throughout the city; more urban areas tended to vote for Moon, while neighborhoods like Magnolia and Queen Anne were firmly in Durkan’s column.
The final tally was Durkan with 56.25%, Moon with 43.75%.